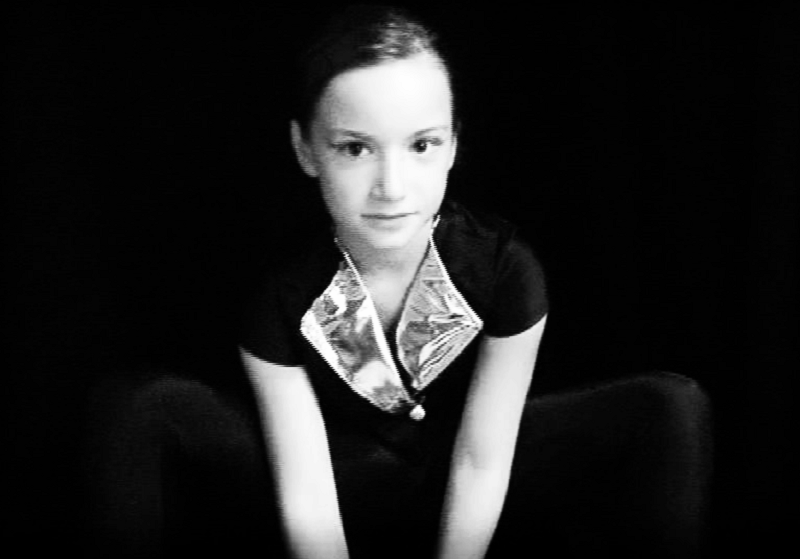
Jeune apprentie ballerine, elle des plus attentionnée, dans l’attente toute de se lancer enfin dans l’arène des mille feux de la rampe, tous exclusivement concentrés sur elle… prête toute à exécuter les tout premiers pas de la chorégraphie mise à sa disposition, élaborée par sa maîtresse de danse classique… en route pour l’envol de leurs tout premiers pas….
Toute entière, corps et âme, à leur parfaite exécutions, échappée aux attentions conjuguées sur elle de tout une foule entière, ses parents y inclus, tapis, mille objectifs attachés à ses pointes et pas… tout ôtant sourde à leurs bruyantes comme bruissantes acclamations et crépitants applaudissements…
jusque au bout, à la révérence, genoux ployés, apprise elle aussi, de rigueurs, à leurs endroits…
Yeux, dites-nous, sans ambages où se gâchent, ou mieux gisent, tout aussi bien le vrai que tant de faux, eux dispos à de telles profusions!
Sous le rêve qui passe, et pour si proche lasse; tout aussitôt mais déjà propulsé en de lointains ailleurs… empruntant tant de cours, mais issus d’autres modes… tout comme ivre encore de plus d’espaces que ceux offerts jusque ici; empreints d’autres fragrances; dévidées litanies de psaumes encensés, comme encore et omnivores.
: – La vérité! Clamaient à mixtes voix et cris, des foules en délire! Avant même le pain, les jeux!
Sommée de se tenir dispose, désormais, cela sans faux-fuyant, à portée de leurs faims.
: – La foi! En hurlaient d’autres, creuset de toutes joies!
Dont se fige la sauce, en des temples de plus, décrétés éternels; aux dédales feutrés de couvents moins diserts; flous relents grégoriens.
Prendre le voile… à la suite comme fuite mais de déjà tant d’autres… et puis se terre; hisser celles les plus vastes et fastes, pour gagner, le tenter toutes hautes mers; vents arrière, de côtés, et tout ôtant de farce; comme encore dits contraires…
Ne saurait excuser, écluser d’une soute lors à tant de voie d’os, le trouble qu’en une âme, la votre sut, là comme à temps perdu, histoire de le distraire, trop vigoureusement enraciner?
Le cierge que l’on plante, à bout vrillant, forgé, de fer, tout de cire épandue, dont la vie n’est que flamme que brises suffiraient…
que paume d’une main, conque de moite nacre, emporte à leurs travers; les doigts d’une autre, seule, égrainant aux entoures le buis d’un chapelet; las tout à leurs semailles mais déjà de par trop tardif automne;
de tocsin, l’aigrelette sonnaille… appel à Complies… qui sait, pour de maigres récoltes, de juste pailles fourragères, ronces, ivraies en vrac…
: – Ou presque? Pourraient tempérer quelque creux de ces foules tassées, de par telles exagérément excessives!?
Ah mais voilà! Il vous reste toujours, mieux ferré que hameçon en revers de la gorge, quoique des plus succinct, un espoir mais possible toujours de quelconque recours?
Yeux, mais ici comme las, sourdement embués, émis aux bains taris; larmes se voulant d’apparat; portées à fleurs de coites commissures; en guise de joyaux; où girent et valsent à l’envi mille étoiles de plus, bris, échardes, copeaux tout comme éclats de pluies, qui ne seraient pourtant jamais de trop;
Yeux attachés, nostalgiques à leurs enfances, mais, depuis, goulûment dévorées; jetées aux roides flammes de l’oubli;
Yeux de ce bleu si propre aux horizons lointains, mais bientôt mis en berne.
Le dieu de leur credo, qu’ils le veuille ou rien, n’est cent fois plus le mien; plié de forge plus que grès à mes vouloir bons ou mauvais; livré aux feux de mes canons, lardé aux salves de leur plomb.
: – A dieu, donc! Le naufrage, crois-le, lui est, comme le leur, des plus suavement serein; à sa suite ou au mieux le précédant; à drus bris me réclame; un anneau, de mon doigt, depuis tant disparu, en son cercle m’aspire; en sa vase, englouti, m’immerge, m’éponge, ou tout comme me gomme; où s’enlise ma foi…
Yeux de retours enfin au champs d’unique croix; plain chant de seule voix pourtant portée aux mille voûtes de toits ras.
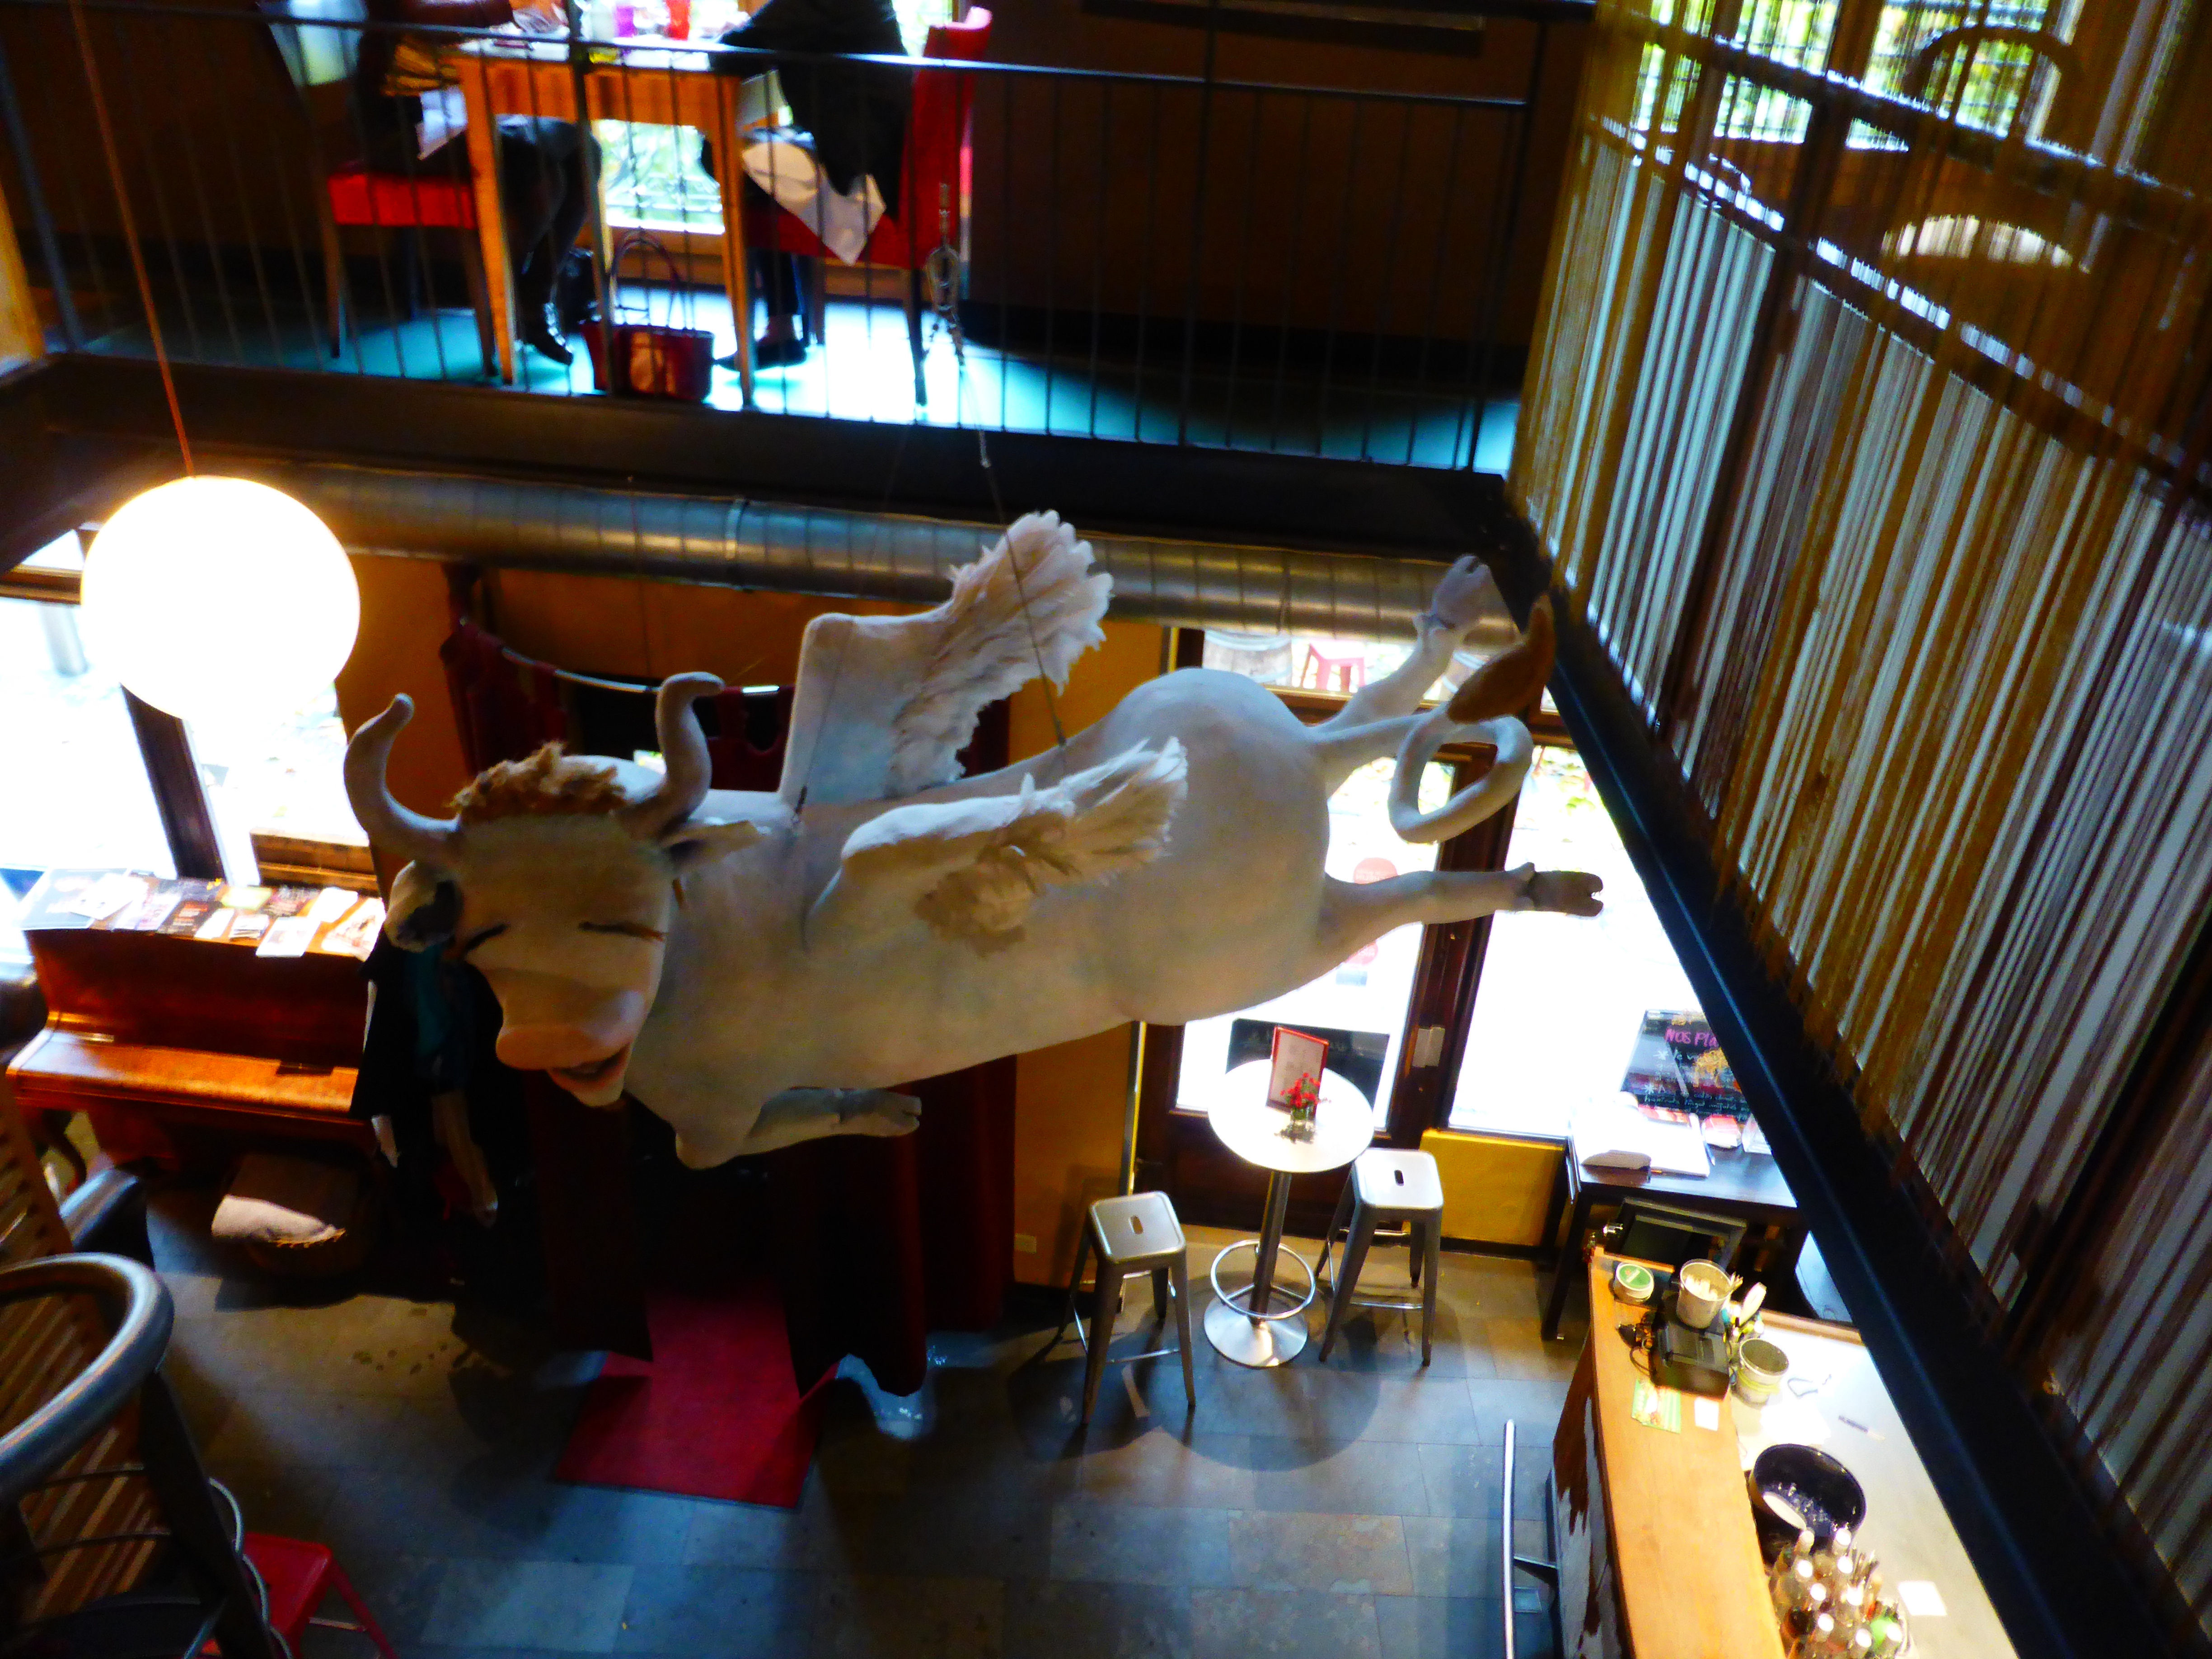
Yeux! Mais sachez qu’à l’encontre de tout ce que l’on serait fort en droit de panser, Heel lui prête une oreille des plus inattentive; livré seul à ces rythmes indécis, sans cesse louvoyant, de danses plus mutines…
Le sabots, de guingois, de bois brut, et cinglant les dalles à l’entour… jusque à perte de rues… Là,contre toute attente, fort docile, quoique apparemment, à l’emploi; gentiment guilleret;
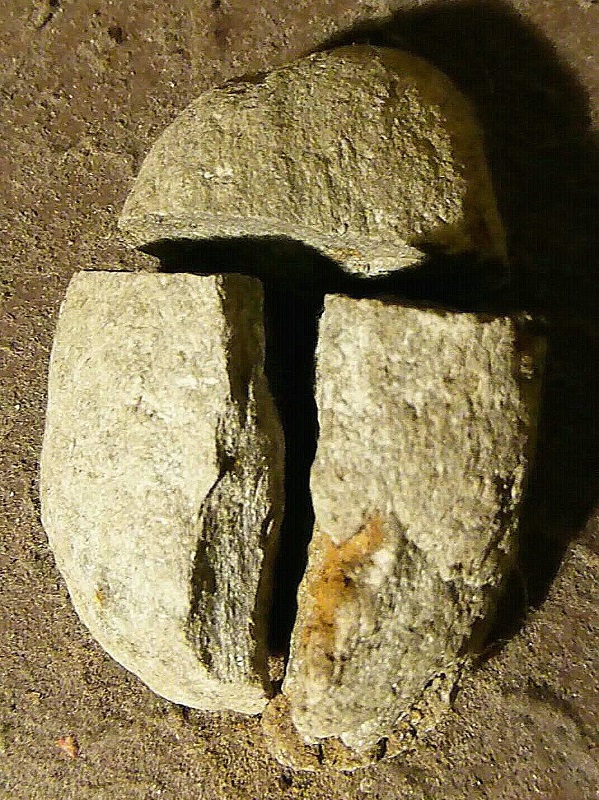
Zour: Pierre fendue en trois, selon les règles préconisées par Nohe, éminente comme avisée Minéraulogue:
Une association de jeunes poétesses et poètes, fondée et dirigée ensuite par le Pélikhan Blanc ; solide gaillard à la voix de stentor, poète-teinturier-brocanteur ; éditeur d’une revue publiée par ses soins et initiateur de plusieurs récitals poétique, dans un local privé, tout d’abord, puis au Petit Théâtre de Sion.
Groupe composé, entre autres, de celle baptisée par l’auteur Puberté, amie du Pélihkan ; une autre jeune poétesse, amie elle de Jean-Michel Mayor, à qui l’auteur dédia ses Soleils, en hommage, suite à son brutal décès, à l’âge tout juste de vingt ans ; retrouvé pendu ; Simone Collet, poétesse vaudoise ; enfin Pierre-André Mihlit.
C’est peu après cette tragique disparition que l’auteur décidait d’abandonner ce groupe, de retour à son état de loup solitaire.
Pour ceux qui ont parcouru un premier chapitre des Ambiances proposées par l’auteur, y ayant survécu, celui-ci leur offre la possibilité de découvrir leur suite.
Qu’ils se rassurent, toutefois, auteur se devant de leur préciser, suite et fin!
Il n’y en aura pas d’autres, c’est promis.
Avec toujours, comme fond musical, un choix de chants Grégoriens enregistrés par l’auteur.